For today’s post, I’m going to take a brief look at the neat command line tool ngrep. This is a very useful tool that I always have on hand for some really quick PCAP analysis. It’s actually quite feature-rich, and allows for packet dumping as well. Let’s take a look at some features:
ngrep
Simply put, ngrep is a tool that provides grep capabilities at the network layer. ngrep can be used to examine packet capture (“PCAP”) files, as well as capture live traffic on a local interface. Analysts can input either regular or hex expressions to be matched against packets, Berkeley Packet Filter (“BPF”) syntax when sniffing, and the tool recognizes a myriad of traffic types. Not bad for a little command line tool!
Here’s an example of monitoring local traffic:
ngrep eth0
After running the command, the tool tells us that it is monitoring on the specified interface. Each “#” that is recorded is a packet received. Without any sort of filtering or output option, we are essentially just confirming packets coming across an interface. Let’s add a few more options:
ngrep -d eth0 port 80
In the example above, we specified traffic on port 80, obviously looking for HTTP traffic. I then went and opened http://www.firefox.com, which we can clearly see from some of the first packets. Now, this looks a bit more familiar!
Notice we’ve got the expected fields from this type of traffic, including User Agent, HTTP method, src/dst IPs, etc. However, it’s still a bit convoluted. We haven’t done any sort of matching. Let’s use the power of a regex to actually give us data we may be particularly interested in:
ngrep -d eth0 '^GET' port 80In the command above, I continued specifying the eth0 interface and monitoring port 80, however this time I’ve specified a regex of ^GET, asking the tool to only give me lines where GET are the first three characters — essentially focusing only on HTTP GET requests. Here’s our output:

Much cleaner! I made a request to yahoo.com, which involved a ton of other packets, but only one GET request matched. Note though the other “#” characters around the traffic. These are additional packets that were observed, but ignored because they didn’t match the specified pattern. We can actually remove those with a -q flag.
ngrep output can also be saved to a local PCAP file using the -O switch. This may not be the most feature-rich packet capture tool, but it certainly is a quick and easy way to quickly grab traffic!
ngrep with PCAPs
Now that we’ve walked through some short and sweet options at monitoring live traffic, we can apply the same logic to historical PCAP files as well. Here’s an example:
ngrep -I http.cap '^GET' port 80I pulled down the sample file http.cap from Wireshark’s SampleCaptures page for this test. Here’s our output:

Notice the tool still displays surrounding packets, but we are only provided detail that matches our regex. We can also look at applying a simple text filter to find packet payload data that matches a word of interest. I’m going to search the same http.cap looking for the word Linux:
#> ngrep -I http.cap 'Linux' port 80 -q | wc -l
99
By using the -q output, we ignore packets that don’t match. I piped to wc -l to count how many packets have Linux in them. Let’s look at the first few lines:
ngrep -I http.cap 'Linux' port 80 -q | head
Notice our hash marks are gone, and we’ve got a single line match. This exact purpose is what I often use ngrep for; quickly determining if content I am interested in is within the PCAP I have. However, there can also be downfalls. Consider the following command:
ngrep -I dhcp.pcap
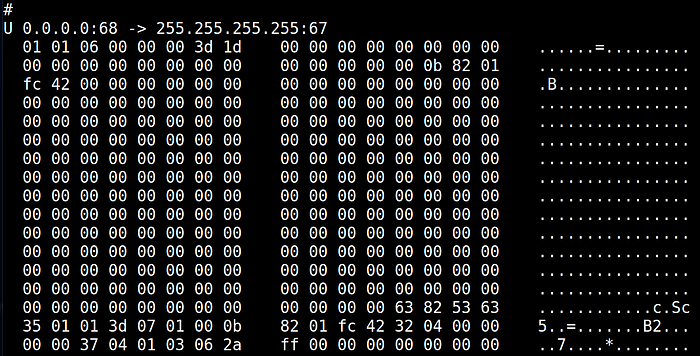
Notice that in this case, where we don’t necessarily have ASCII text, we get what looks like raw data. This is where particular protocol introspection, such as what is offered by Wireshark, becomes extremely useful. However, we can throw ngrep a -x flag to get the raw hex output:
ngrep -I dhcp.pcap -x
Here’s Wireshark for comparison:

Obviously, it’s not as clean, however this may not be the best use for ngrep. However, at minimum it’s a powerful tool to inspect both historical and live traffic, and provide filters to zoom in on only what matters. Because it’s script-able, we can also pipe ngrep output to a myriad of other tools, including potentially grep itself! ngrep could also be used to search through a list of IOCs, potentially finding quick wins.
Until tomorrow, Happy Forensicating!
